
Travel Friend, ZenTech >
Climate Guide >
Japan Climate
Nagano Temperature
Nagano Temperature and Precipitation Graph
Japan Map(Google Map)
Now, Map data loading .....
(If the map is not displayed, There is a possibility to be able to display by permitting JavaScript.)
|
|
Today, Weather of Nagano

English : Today and Weekly, Nagano Weather Forecast (Japan Weather Association = JWA)
Nagano, Nagano Prefecture (長野県長野市) Temperature & Precipitation Monthly Averages
| Month | Jan | Feb | Mar | Apr | May | Jun | Jul | Aug | Sep | Oct | Nov | Dec |
| Average High Temperature (°C) | 3.4 | 4.2 | 8.9 | 17.1 | 22.2 | 25.3 | 28.9 | 30.5 | 25 | 18.8 | 12.7 | 6.6 |
| Average Low Temperature (°C) | -4.3 | -4.1 | -1.1 | 4.8 | 10.1 | 15.6 | 19.8 | 21 | 16.5 | 9.2 | 2.9 | -1.9 |
| Average Precipitation (mm) | 44.2 | 47.5 | 53.6 | 59.5 | 76 | 114.7 | 137.1 | 95 | 130.1 | 70.2 | 40.9 | 38.2 |
Tokyo (東京) Temperature & Precipitation Monthly Averages
| Month | Jan | Feb | Mar | Apr | May | Jun | Jul | Aug | Sep | Oct | Nov | Dec |
| Average High Temperature (°C) | 9.8 | 10 | 12.9 | 18.4 | 22.7 | 25.2 | 29 | 30.8 | 26.8 | 21.6 | 16.7 | 12.3 |
| Average Low Temperature (°C) | 2.1 | 2.4 | 5.1 | 10.5 | 15.1 | 18.9 | 22.5 | 24.2 | 20.7 | 15 | 9.5 | 4.6 |
| Average Precipitation (mm) | 48.6 | 60.2 | 114.5 | 130.3 | 128 | 164.9 | 161.5 | 155.1 | 208.5 | 163.1 | 92.5 | 39.6 |
| Rainy Days | 4.6 | 5.8 | 9.5 | 10.1 | 9.6 | 11.9 | 10.4 | 8.2 | 11.3 | 9.1 | 6.2 | 3.8 |
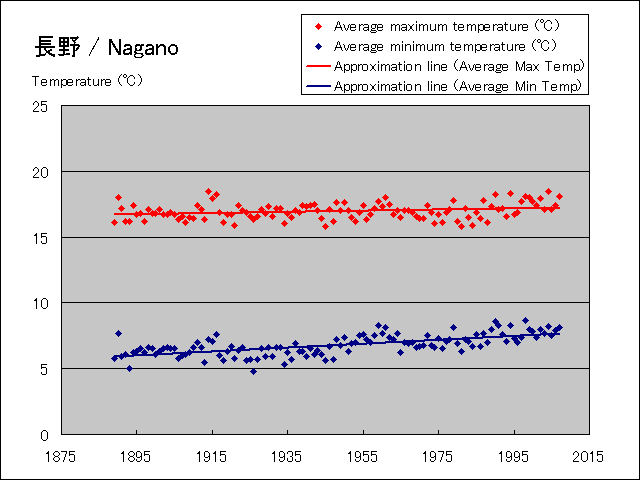
Rising graph of mean maximum temperature and mean minimum temperature of Nagano by global warming.(Data from 1889 to 2007)
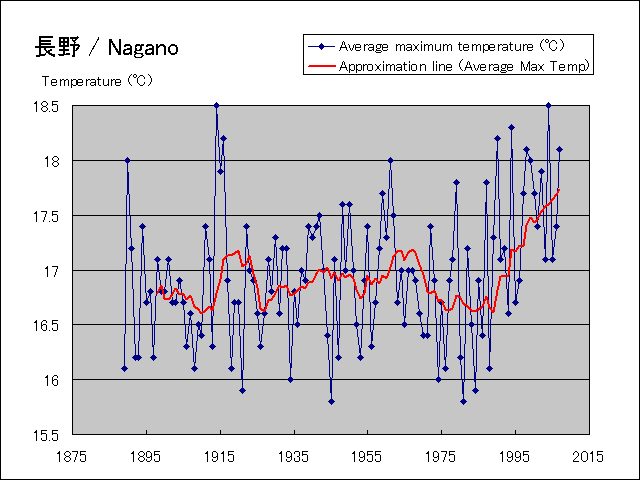
Detailed change graph of mean maximum temperature of Nagano.(It is moving average data for ten years from 1889 to 2007.)
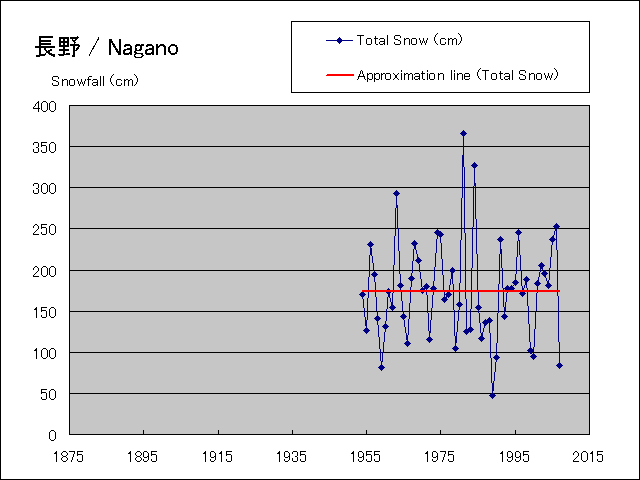
Change graph of snowfall during year of Nagano(Data from 1954 to 2007)
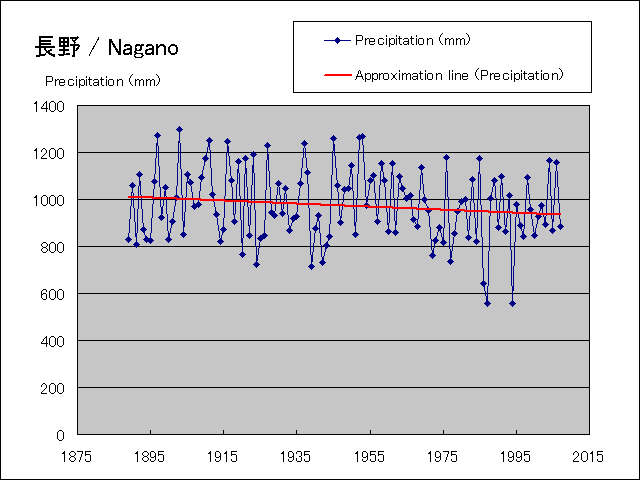
Change graph of annual rainfall of Nagano(Data from 1889 to 2007)
To the top (Nagano Temperature)
 (Japanese)
Copyright © 1997-2023 ZenTech. All Rights Reserved.
(Japanese)
Copyright © 1997-2023 ZenTech. All Rights Reserved.
